Blog post · Academia
Authorship inflation at OSDI: counting papers two ways
OSDI author lists have more than doubled since 1994. Whether the field's most prolific authors are actually publishing more depends on whether a paper counts as one, or as one divided by its author count.
How many people does it take to write an OSDI paper? In 1994 the answer was about three. Today it is about seven. That drift sounds mundane, but it quietly breaks the way we usually measure productivity: if a paper counts as one unit of credit for every name on it, the total credit handed out per paper has more than doubled while the paper itself has stayed one paper.
This post looks at every main-track OSDI paper from the conference's founding in 1994 through 2026 — 831 papers across 20 editions1 — and asks two questions. First, how has the author list grown? Second, what happens to the field's most prolific authors if we switch the accounting from full counting (each author gets 1 per paper) to fractional counting (each author gets 1/n for an n-author paper)?
The data comes from DBLP, filtered to the main-track program; OSDI 2026 is not yet in DBLP, so its 136 papers come from the USENIX technical program. The per-year counts match the published program sizes.
Author lists have doubled — and the tail has exploded#
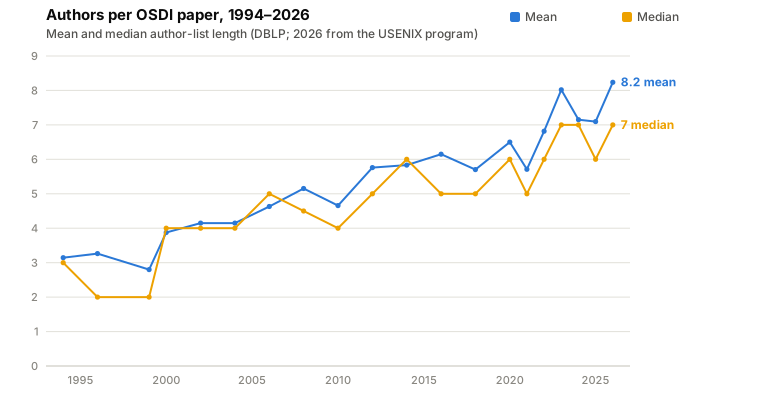
The mean author-list length rose from 3.1 in 1994 to 8.0 in 2023, and the 136-paper 2026 program sets a new high of 8.2. The median tells the same story — 2 to 3 in the 1990s, 7 now — so this is not just a few outliers dragging the average.
But the outliers are worth meeting anyway, because they mark a real change in what an OSDI paper is:
- Spanner (2012) — 26 authors
- TensorFlow (2016) — 22 authors
- Flor (2023) and RLinf (2026) — 29 authors each, the joint record
The industrial mega-paper barely existed early on. In the first six editions (1994–2004), 3.6% of papers were single-authored and only one paper in 138 had ten or more authors. In the nine editions since 2016, not a single paper was single-authored, and papers with ten or more authors were 20% of the program. The 2026 edition pushes that further: 36 of its 136 papers — more than one in four — carry ten or more authors.
Two forces are visible here. Systems work itself got bigger: you cannot evaluate a cluster scheduler or a datacenter database without the team that runs one, so industrial deployments bring long author lists with them. And norms shifted: crediting students, engineers, and collaborators generously costs nothing under the prevailing accounting — which is exactly the accounting question the rest of this post is about.
Two ways to count a paper#
Full counting gives every author one unit per paper. It answers "how many OSDI papers is this person on?" It is how CVs, faculty dashboards, and csrankings-style leaderboards work, and its defining property is that credit is not conserved: a 29-author paper mints 29 units.
Fractional counting divides each paper equally among its authors — 1/n each. It answers "how many papers' worth of work can we attribute to this person?" Credit is conserved: every year's proceedings hands out exactly as many units as it has papers, whether that is 21 papers in 1994 or 136 in 2026.
Neither is "correct" — author position, advising roles, and who wrote the code are all invisible to both. But comparing them exposes precisely the distortion that growing author lists introduce, because the two schemes agreed reasonably well in 1994 and do not agree at all today.
The year's top authors, under each rule#
First, the single most-credited author of each year:
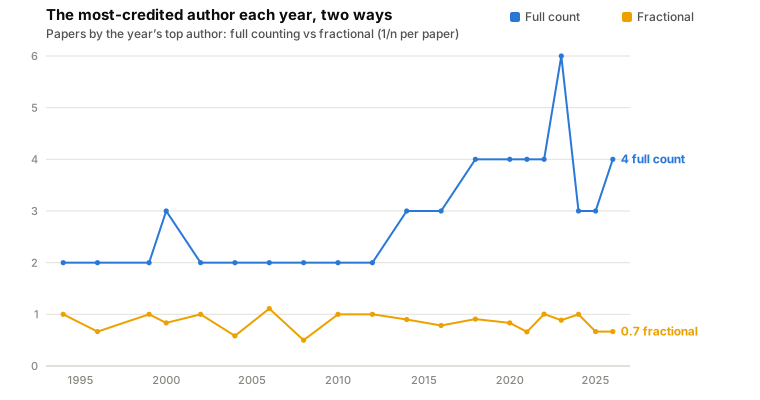
Under full counting, the ceiling has risen: for nearly two decades no one appeared on more than 2–3 papers in a single OSDI, then 4 became routine in the late 2010s, and in 2023 one author was on 6 of the 55 papers. And yet the 136-paper 2026 program — more than twice the size of any earlier OSDI — produced a top author on only 4 papers. Under fractional counting the line is astonishingly flat: the best fractional haul of the year has hovered around 1.0 paper-equivalent since 1994, peaking at just 1.11 in 2006. Being on six papers in 2023 earned less fractional credit (0.89) than a single solo-authored paper — a routine sight in the 1990s programs and an extinct one today.
The all-time leaderboard also disagrees with itself#
The same lens applied to all 20 editions at once. By full counting:
| Rank | Author | Papers (full) | Credit (fractional) | Fractional rank |
|---|---|---|---|---|
| 1 | Haibo Chen | 24 | 4.10 | 3 |
| 2 | Ion Stoica | 22 | 3.26 | 5 |
| 3 | Nickolai Zeldovich | 20 | 4.99 | 1 |
| 4 | M. Frans Kaashoek | 20 | 4.14 | 2 |
| 5 | Lidong Zhou | 18 | 2.34 | 10 |
| 6 | Fan Yang | 15 | 1.48 | 41 |
| 7 | Rong Chen | 13 | 2.61 | 9 |
| 8 | Jason Flinn | 13 | 3.74 | 4 |
| 9 | Andrea C. Arpaci-Dusseau | 13 | 2.72 | 7 |
| 10 | Remzi H. Arpaci-Dusseau | 13 | 2.72 | 8 |
And by fractional counting:
| Rank | Author | Credit (fractional) | Papers (full) | Full rank |
|---|---|---|---|---|
| 1 | Nickolai Zeldovich | 4.99 | 20 | 3 |
| 2 | M. Frans Kaashoek | 4.14 | 20 | 4 |
| 3 | Haibo Chen | 4.10 | 24 | 1 |
| 4 | Jason Flinn | 3.74 | 13 | 8 |
| 5 | Ion Stoica | 3.26 | 22 | 2 |
| 6 | Larry L. Peterson | 2.82 | 9 | 25 |
| 7 | Andrea C. Arpaci-Dusseau | 2.72 | 13 | 9 |
| 8 | Remzi H. Arpaci-Dusseau | 2.72 | 13 | 10 |
| 9 | Rong Chen | 2.61 | 13 | 7 |
| 10 | Lidong Zhou | 2.34 | 18 | 5 |
Nine of the ten names appear on both lists, which says the schemes are measuring something real in common. The two exceptions say the rest. Fan Yang is on 15 OSDI papers — sixth all-time by full counting — yet ranks 41st fractionally, because those appearances came on papers averaging ten authors each. Larry Peterson runs the other way: 25th by full count but sixth fractionally, carried by small-team papers from the era when three authors was normal. And the fractional list's top is dominated by people whose OSDI careers were built on 3–5 author papers: Nickolai Zeldovich's 20 papers at ~4 authors each outweigh Haibo Chen's 24 at ~6. (Andrea and Remzi Arpaci-Dusseau enter both top tens on the strength of three co-authored papers in 2026 alone.)
What I take away from this#
I do not think fractional counting is the "honest" number and full counting the dishonest one. A 26-author Spanner paper genuinely required 26 people, and the students buried in the middle of those lists did real work that 1/26 badly understates. But the comparison teaches three things:
- Any leaderboard built on full counting is measuring collaboration surface, not output. A 2023 "6 OSDI papers this year!" claims 6 units of full-counting credit but is worth only 0.89 paper-equivalents by the fractional yardstick — roughly a 7× gap between the nominal and fractional tallies for the same haul.
- Per-author productivity at OSDI has been remarkably constant. The flat fractional ceiling — nobody has ever taken home much more than one paper-equivalent from a single OSDI in thirty years — suggests the real constraint was never the publication count but the human attention behind it.
- Cross-era comparisons need conserved units. This is the same measurement instinct systems people apply everywhere else: when a metric's denominator is drifting, normalize before you compare. Papers per author inflates; paper-equivalents do not.
Three decades is enough to watch the unit of academic credit quietly change underneath a fixed-looking metric — and the 136-paper 2026 edition shows the drift is accelerating, not settling. The next time a ranking tells you who the most productive systems researcher is, ask which counting rule it used. The answer usually decides the ranking.
Footnotes
-
OSDI was roughly biennial from 1994 to 2020 (with editions in 1999 and 2000 rather than 1998 and 2000) and has been annual since 2021; the 20 editions span 1994–2026. Records for 1994–2025 were pulled from DBLP's OSDI stream in July 2026; author identity there uses DBLP's disambiguated person IDs, so distinct researchers who share a name are counted separately. OSDI 2026 was not yet in DBLP at the time of writing (its proceedings become public on July 13, 2026), so its 136 papers come from the USENIX technical-sessions program, and its authors are matched to DBLP identities by name for the all-time tables. Abstract-only entries, panel statements, and co-located workshop papers are excluded. ↩